

CALCULATOR ACCURACY
Summary
The return & variance calculator and "Are My Results?" fair calculators assume a normal statistical distribution. This assumption holds up well for most games. The key games where this assumption is not valid without a large number of wagers are Video Poker, Hold'em High, Let It Ride, and Ultimate Texas Hold'em. I recommend using the return & variance simulator instead of the calc for these 4 games when practical. I've removed these games from the "Are My Results Fair?" calculator. They still appear in the return and variance calculator since some of the most used outputs do not require a large number of wagers, such as EV in standard mode.
The table below shows the measured number of 1-unit wagers for chance of gain, chance of bust, chance of win/loss, and limited bankroll EV to have +/- 2% accuracy in a group of simulations. "Very high" indicates at least 100k wagers for all outputs to have +/- 2% accuracy. Some calc outputs will have high accuracy at lower numbers of wagers, particularly chance of gain. For example, the chance of gain for Hold'em High is usually within 1% at 1500 wagers.
| Game | Number
of Wagers |
Number
of Hands |
| 3-Card 2nd Chance |
1000 |
800 |
| 3-Card Poker (Ante & Play) |
100 |
60 |
| 3-Card Rummy |
100 |
60 |
| Baccarat (Banker) |
30 |
30 |
| Blackjack |
40 |
35 |
| Caribbean Draw Poker |
5000 |
1500 |
| Caribbean Hold'em |
300 |
100 |
| Caribbean Stud Poker |
500 |
250 |
| Casino Hold'em |
300 |
100 |
| Casino War |
100 |
90 |
| Craps |
40 |
20 |
| Hold'em High |
very high |
very high |
| Let Them Ride |
very high |
very high |
| Oasis Poker |
3000 |
1400 |
| Pai Gow Poker |
30 |
30 |
| Pontoon |
120 |
100 |
| Red Dog |
500 |
400 |
| Roulette |
400 |
400 |
| Sic Bo |
400 |
400 |
| Texas Hold'em Bonus |
75 |
20 |
| Triple Action Hold'em |
200 |
100 |
| Triple Pocket Hold'em |
1500 |
1100 |
| Video Poker |
very high |
very high |
| Ultimate Texas Hold'em |
very high |
very high |
Discussion
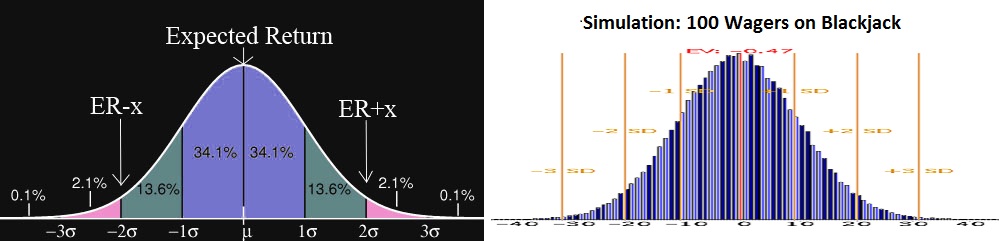
The return & variance calculator computes chance of gain, chance of bust, number of SDs, and limited bankroll EV by approximating results as a normal distribution, as pictured in the bell curve on the left. As the number of wagers increases on a random, independent game, the distribution of results approaches this curve. In contrast, the return & variance simulator makes no approximations and instead simulates the data and plots where the results land. The curve on the right is a screenshot from the simulator showing a simulation of 100 units wagered on blackjack, with a bet size of 1 unit. With only 100 wagers, the simulator output looks very similar to the ideal normal curve. There are some jagged edges, suggesting results will not be dead on, but all calculator outputs should all be close estimations to their true value. You can confirm this by comparing results between the simulator and calculator.
The return and variance calculator requires more hands for accurate results in games that have rare, high payouts, such as poker games with a royal flush. Some royal flush table games only require a few hundred wagers for accurate results, such as Triple Action Hold'em and Casino Hold'em. In Triple Action Hold'em royal flushes result in a net win of 51-52, straight flushes win 21-22, and the next highest payout wins 8. After a few hundred hands, the royal flush pay falls near the +/-2SD range. The expected rate of hitting a royal over a few hundred hands is far below a +2SD event, so it has minimal impact.
Some of the other poker games, such as Oasis Poker and Caribbean Draw, require a few thousand wagers for all of the outputs to have good accuracy. After 1000 wagers on Caribbean Draw, the calc estimates 1 SD as ~60 from the mean. The royal payout of 200 is more than 3SDs beyond the mean, so for an accurate normal curve distribution, royals should have a rate well below 0.1%. There is a ~0.5% chance of hitting a royal in 1000 wagers (1000 units wagered, ~340 initial bets), which is well above the expected <0.1%. This is enough to distort results. Consider a 100% to $100 pre-wager bonus with 50xB wagering on Caribbean Draw and a bet size of 5. This is 1000 wagers, so the calc outputs should have an error. The calc estimates an EV of $77 and a 53.0% chance of bust. Loading the same bonus into the sim, it estimates an EV of $76 and 51.8% chance of bust. A $1 EV difference and 1% bust difference is not enough to concern most players, but it is a statistically significant error in the calculation.
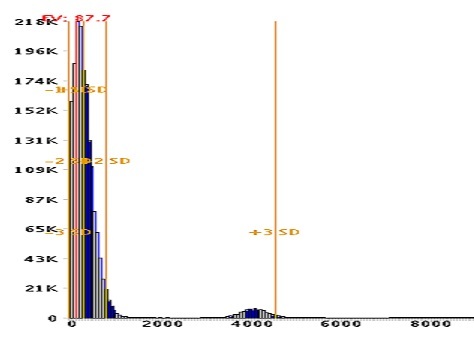
The key games that may have more significant differences are Video Poker, Hold'em High, Let It Ride, and Ultimate Texas Hold'em. These games all have a very large royal payout of 500+ that is far enough beyond the primary bell curve to reduce accuracy of outputs. Consider the same 100% to $100 bonus with 50xB wagering discussed earlier. If the wagering is done on 1-play Jacks or Better instead of Caribbean Draw, then the calc estimates an EV of $92 and 78% chance of bust, while the sim reports an EV of $88 and 64% chance of bust. The bust difference is enough that it may influence decisions, such as choice of bet size. Looking at the sim histogram output graph, it's easy to see why this difference occurs. I've cut and pasted the histogram below. It shows a 2nd smaller bell curve centered around 4000, far beyond the primary partial bell curve (partial because bankroll is limited). This second curve corresponds to hitting a royal during the wagering. It's no where near the rest of the data, so it distorts results. For precise 1-play video poker calculator results, you'll often need to wager enough to expect to hit several royals, which is hundreds of thousands of hands. Note that the EV in standard mode is accurate for all number of hands since it is a simple bonus - wager * HE calculation that does not require a normal distribution. I've removed these games from the "Are My Results Fair?" calculator to reduce confusion.
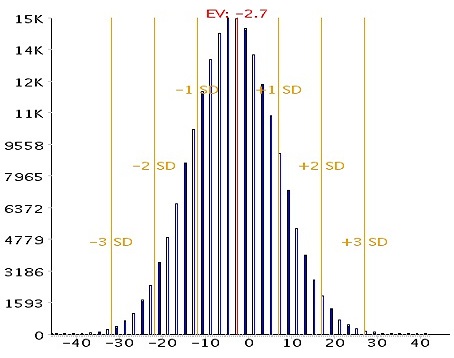
Some of the games that do not have rare, royal payouts may require a few hundred hands for good accuracy. In some cases games without large payouts may have worse accuracy than games with rare, royal payouts. This relates to a limited number of final results over a few hundred hands in games with low payouts. As an example, the graph below shows a simulation of 100 spins on roulette with a 1:1 red/black bet. The gaps between events are more noticeable than in the earlier graph of 100 wagers on blackjack since the blackjack final returns are multiples of 0.5 (BJ pays 1.5 to 1), and the roulette final returns are multiples of 2 (even number of 1:1 bets). The sim reports a 43% chance the overall return is at least 0 and a 35% chance the return is at least 0.01. There is a 8% difference since there is a 8% chance of a return being exactly 0. The calc lists the same 39% chance of gain for both 0 and 0.01 since it assumes a smooth normal curve, without large steps.
Copyright © 2014 www.beatingbonuses.com. All Rights Reserved.