

INTERPRETING "ARE MY RESULTS FAIR?" RESULTS
Summary
It is common to feel suspicious of game fairness after getting a return that is well below EV, even when one has had results that are well above EV with the same software. The "Are My Results Fair?" calculator measures how rare a loss is and gives an indication of whether the results really do indicate that the game is unfair or whether the results fall in the realm of "normal variance." I believe that the larger, well known softwares do offer a fair game. However, some of the smaller, lesser known softwares have been proven to have non-random results.
Discussion
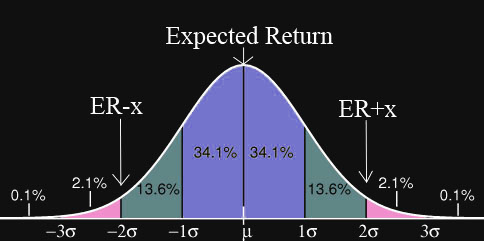
The "Are My Results Fair?" calculator returns how rare a loss is by approximating results as a normal distribution, as pictured in the bell curve above. This is a good approximation for games without large rare payouts, like blackjack. It can be a poor approximation for games with rare high payouts, like video poker, when you do not play enough hands to be expected to hit those rare payouts. Similarly blackjack estimations decrease in accuracy for a very small number of hands when a single rare, large resplit+double payout has a significant impact on results.
The number of hands played is a key value for evaluating fairness of results. The more hands that are played, the closer the payout % is expected to be to the mean. For example, after 1000 1-unit bet hands of BJ, the 1 standard deviation range of the mean payout is +/- 3%. So a 97% payout would be perfectly normal. After 10,000 hands, the 1 SD range for the payout decreases to +/- 1%. After 1 million hands, it is +/- 0.1%. The further the true house edge is from the expected, the fewer hands are needed to confirm this difference.
The average return corresponds to the central point in the graph, marked µ. A 1.0 standard deviation loss corresponds to a result at the point where green meets blue marked -1σ. Note that 13.6+2.1+0.1% = ~16% of the graph area falls to the left of the -1σ, so there is a 16% chance of getting a 1.0 standard deviation loss or greater. The calc outputs of percentage chance and 1 in ... are based on similar estimations using the number of standard deviations from the mean. As summary of interpreting a number of standard deviations loss/win is below:
1 SD Loss -- 68% of results are expected to fall within 1 standard deviation of the mean. There is roughly a 1 in 6 chance of a 1SD loss and a 1 in 6 chance of a 1SD gain. 1SD losses are quite normal.
2 SD Loss -- 95% of results are expected to fall within 2 standard deviations of the mean. There is roughly a 1 in 44 chance of a 2SD loss. 2SD losses are not a cause for alarm, but they should be fairly rare.
3 SD Loss -- 99.7% of results are expected to fall within 3 standard deviations of the mean. There is roughly a 1 in 740 chance of a 3SD loss. 3 SD losses should be quite rare and should not occur on a regular basis. However, a single 3SD loss is not proof of unfair software.
4 SD Loss -- 99.994% of results are expected to fall within 4 standard deviations of the mean. There is roughly a 1 in 32,000 chance of a 4SD loss. 4 SD losses should hardly ever occur. A single 4SD loss is not certain proof of unfair software, as rare events do happen. However, I consider a 4 SD loss rare enough to start investigating the results and comparing data with other players. If other players are reporting similar rare losses, there is a lack of rare wins, and/or the rare results are repeatable; it may indicate non-random software.
5 SD Loss -- There is roughly a 1 in 3.5 million chance of a 5SD loss. A 5 SD loss is a strong indication of non-random software. I cannot recall ever seeing a 5SD win/loss in a software that is thought to be fair and working correctly.
6 SD Loss -- There is roughly a 1 in a billion chance of a 6 SD loss. A 6 or greater SD loss is a near certain indication of problematic software.
>6 SD Loss -- Players have reported much more than 6 SD losses at some small softwares that are thought to be unfair. For example, two players reported a 12 SD loss with AST/ThrillX softwares (see warning), and a player reported an 18 SD loss with Casinova software (see warning). For reference, the chance of rarer results that should never occur are listed below.
7 SD Loss -- There is roughly a 1 in a 780 billion chance of a 7 SD loss (7.81x10^11).
8 SD Loss -- There is roughly a 1 in a 1.6 quadrillion chance of a 8 SD loss (1.61x10^15).
9 SD Loss -- There is roughly a 1 in a 8.9 quintillion chance of a 9 SD loss (8.86x10^18).
10 SD Loss -- There is roughly a 1 in a 130 sextillion chance of a 10 SD loss (1.31x10^23).
11 SD Loss -- There is roughly a 1 in a 5.3 octillion chance of a 11 SD loss (5.26x10^27).
12 SD Loss -- There is roughly a 1 in a 570 nonillion chance of a 12 SD loss (5.69x10^32).
13 SD Loss -- There is roughly a 1 in a 170 undecillion chance of a 13 SD loss (1.66x10^38).
14 SD Loss -- There is roughly a 1 in a 130 tredecillion chance of a 14 SD loss (1.32x10^44).
15 SD Loss -- There is roughly a 1 in a 280 quindecillion chance of a 15 SD loss (2.82x10^50).
Copyright © 2006-2014 www.beatingbonuses.com. All Rights Reserved.